Input descriptor contribution to simulation outputs (tornado plot)
The goal is to assess the impact of input descriptors on specific quantities of interest (QOI) and determine the direction of this effect (positive or negative).
To analyze the contribution of input descriptors to simulation outputs, you first need a Trial Visualization. Click on the "Contribution Analysis" tab to open the contribution analysis panel.
To visualize your results, you can:
- Select outputs: Select any clinical measure defined in the measure design attached to the trial. Click the ‘Update Results’ button to display or update the plots.
- Filter results: Use the filtering options on the left-side panel to apply filters on baseline and output descriptors.
- Group results: By default, all results are grouped by arm. You can also apply various groupings using distinct values, spans, buckets, and quantiles.
- Select baseline descriptors: The contribution analysis is computed with respect to the selected baseline descriptors. Two selection modes are available:
- Input Baseline Only: Selects only the input descriptors which correspond to the scalar inputs of the model.
- All Baseline: Selects both input and formulaic descriptors. These include all descriptors known at the start of a clinical trial.
Analysis Methodology
This analysis identifies which patient descriptors (baseline characteristics) are the strongest drivers of clinical outcomes. Unlike a traditional sensitivity analysis that varies inputs one-by-one, this method leverages the full heterogeneity of your Virtual Patient population.
How it works:
The analysis statistically compares specific patient subgroups against the overall population to measure impact.
-
Baseline Calculation: First, we compute the median of the Quantity of Interest (QOI) for the entire Virtual Population (defined as M_pop).
-
Stratification (Per Descriptor): For each input descriptor (e.g., Age, Biomarker X):
- The entire population is sorted by the descriptor's value.
- The population is split into two equal subgroups: the Lower 50% (Low Subgroup) and the Upper 50% (High Subgroup).
-
Subgroup Analysis: We calculate the median QOI for both subgroups (M_low and M_high).
-
Impact Calculation: We determine the impact of the descriptor by calculating the relative deviation of each subgroup from the total population median: Impact for the Low Subgroup:
(M_low - M_pop) / M_popImpact for the High Subgroup:
(M_high - M_pop) / M_pop -
Visualization (Tornado Plot):
- These deviations are plotted as horizontal bars centered on the population median ().
- The descriptors are ranked by the magnitude of their total spread (|M_low - M_high|), placing the most influential patient characteristics at the top.
Example
This example uses a random sample of 1,000 patients described by three baseline descriptors: weight.tmin, age.tmin, and bindingRate.tmin.
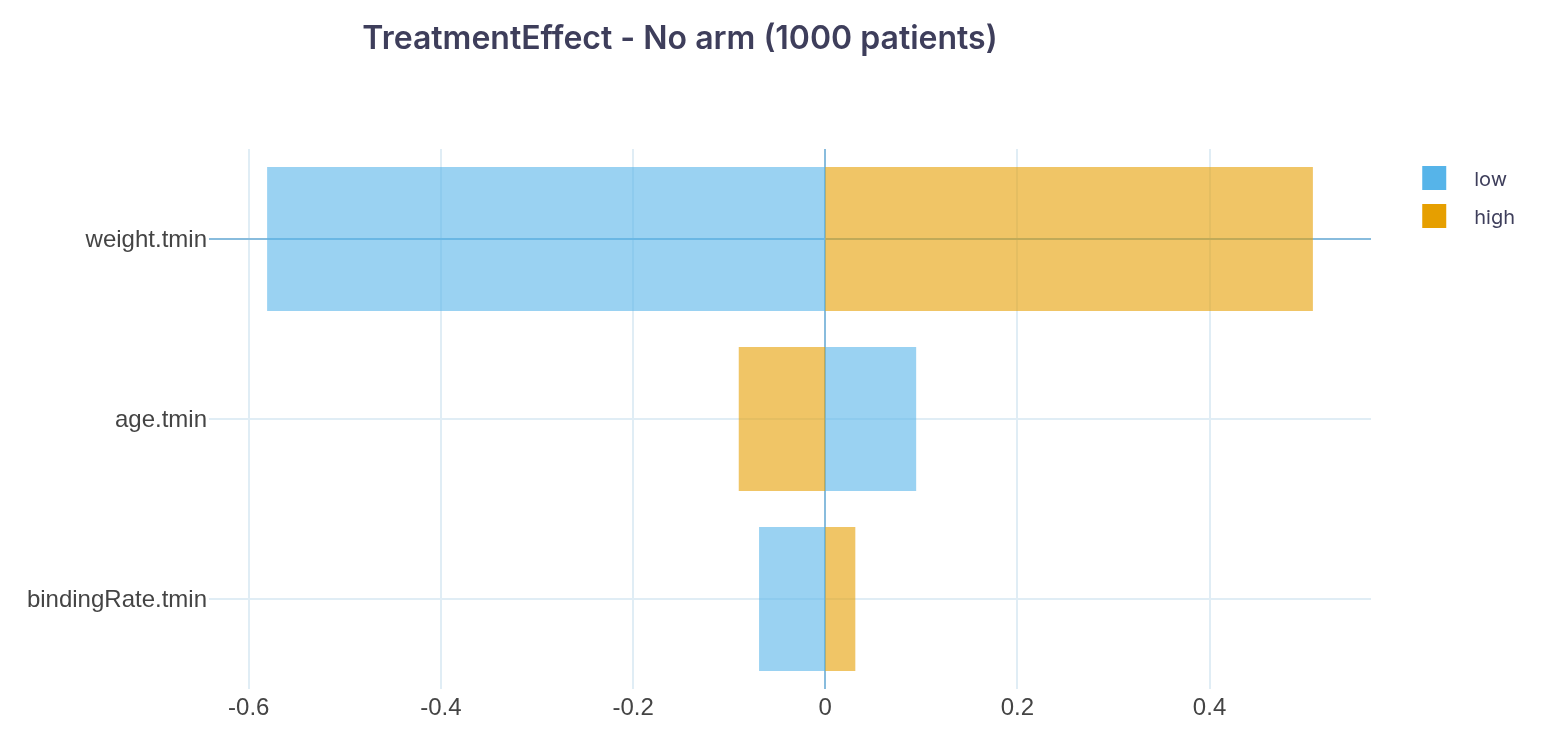
In this plot, based on a univariate analysis of 1,000 patients:
- weight.tmin is the descriptor with the greatest impact on the Treatment Effect. Patients with lower values (first 50% of the distribution) show a median Treatment Effect about 58% lower than that of the overall population, while patients with higher values show the opposite trend (about 51% higher).
- age.tmin is the second most impactful descriptor. Patients with higher values show a smaller negative effect, while those with lower values show the opposite trend.
- bindingRate.tmin is third; its impact is modest and follows the same positive direction as weight.