Part 2. Reconciling knowledge with data to predict clinical outcomes
TL;DR
M&S in MIDD should be designed and run for the patient's health, measured as a clinical outcome. It combines top-down problem solving with the bottom-up principles of conventional systems biology and bioinformatics.
Data alone carries you only so far in predicting how a living organism behaves.
Knowledge is far less context- and time-dependent than raw data, and so a more reliable source for in silico prediction. Multi-scale, mechanistic pathophysiological models built from the scientific literature belong at the center of any in silico framework.
In the VPop, data serves twice: to calibrate and validate the mechanistic model, and to carry between- and within-patient variability so predictions span the range of genotypic and phenotypic profiles.
The Effect Model (EM) bridges simulation outputs and predicted clinical outcomes. It relates the probability of disease-related events without therapy to the probability with therapy, and is summed as a difference per patient. Together with the EM, in silico work supports decisions such as choosing the optimal target combination for a condition and population.
The EM is estimated by combining a formal model of the disease and therapy with a Virtual Population (VP) representative of a geography or context. Summing each patient's clinical benefit gives the Number of Prevented Events (NPE).
What the Nova approach is built for
- making the complexity of biological, physiological, clinical, and epidemiological knowledge interpretable and operational
- reconciling and merging data and knowledge
- predicting, at any point in R&D, the benefit on the clinical outcome that matters to patients, and benchmarking on it
- reducing the failure rate
- answering questions that go unanswered during the R&D of new therapies
- shortening time to market
- translating the knowledge and data accumulated during development into knowledge useful in real life
What is the role of M&S in treatment R&D?
M&S in therapeutic R&D exists to solve problems, the most important of which is relieving the patient's condition. So M&S in model-informed drug development (MIDD) should be designed and run with the patient's health continuously in view. A patient's problem is measured as a clinical outcome, from premature death to impaired quality of life. Ideally M&S combines the top-down principle of problem solving with the bottom-up principles of conventional systems biology and bioinformatics [1], and predicts treatment efficacy on the clinical outcome rather than on a surrogate marker or endpoint.
What data can and cannot tell you on its own
Big and smart data analytics have drawn considerable attention in biomedicine over the past years [2], and they answer a real question: what patterns do the data show? What they are not built to answer is why, and several properties of biomedical data limit how far a purely data-driven prediction of clinical outcome can reach.
Omics on their own are weak predictors of clinical outcomes. Living systems are not built from a limited number of standard parts with interactions encoded in the genome[3]. Most omics databases are observational: Genome-Wide Association Studies (GWAS), for instance, have identified many genetic variations contributing to common complex diseases, but they are case-control by design, so the link between treatments, outcomes, and omics findings is a correlation. Correlation does not establish causation, which is why the randomized controlled trial, with an a priori protocol and randomization to limit bias and confounding, remains the gold standard for demonstrating a causal link between intervention and outcome. No statistical model or propensity score makes patients on different treatments fully comparable at baseline, and a personalized sequence of treatments confounds the picture further.
Outside genomics, within-patient variability, and variability between observational settings, is poorly understood. The dynamics of protein expression, for example, need more exploration. Cross-sectional data say nothing about those dynamics, and sequential data say little, because the path of data collection cannot be harmonized with the timescale of the phenomenon. A snapshot cannot capture behavior. Standardization is another issue: even the most common surrogate markers, such as progression-free survival (PFS) and pathology grading and staging, predict overall survival only roughly. Even in large databases, meaningful rare events or rare variants can be missed for lack of statistical power. And results hold for the data, time, and setting they came from, which limits how far they generalize to prospective patients or to patients treated elsewhere. Sophisticated machine learning does not remove these constraints, because a data-driven algorithm makes inductive predictions from past data by design.
The way forward is to use these increasingly large datasets alongside the trove of knowledge available in the scientific literature. Each answers a different question, and the two are stronger read together than either is alone.
Knowledge-driven modeling
Knowledge is the product of repeated consistent experimental observation, such as a high concentration of ligand-saturated receptors at the cell surface. It is far less context- and time-dependent than raw data, and so a more reliable source for in silico prediction. That is why knowledge has to be treated differently from the observational or experimental data it derives from.
The knowledge gathered on cancer, immunology, and other domains of biology and pathophysiology over little more than half a century is enormous. Measured in original articles, it has doubled every decade since the 1950s[4]; as of February 2016, PubMed indexed 25 million original articles in the biomedical sciences. That exponential growth, combined with the inherent complexity of biology, is why current approaches struggle to turn this body of knowledge into better therapies and better patient care.
Multi-scale models, from genes to cells, tissues, and organs, that are mechanistic, meaning causal, as in "IkB kinase phosphorylates IkB, resulting in a dissociation of NF-kappaB from the complex with its inhibitor", belong at the center of any in silico framework. These formal, that is, mathematical and computational, models of the disease, covering tumors with their microenvironment (TME), the immune system, processes such as metastasis, and the pharmacokinetics and pharmacodynamics of the drug of interest with time-dependent concentration at its target site, represent every relationship between the entities involved in the relevant pathophysiological mechanisms causally (see Box 5).
Knowledge derives from data but differs from it in one major respect: generality. An established piece of knowledge, one with the highest strength of evidence, also called a scientific fact, sits at the top of a pyramid of observations and experiments, and that pyramid is what makes it general. A record in a database comes from a single observation or experiment. Many shots differ from one shot.
The middle-out approach: the Virtual Population
Here data serves two purposes. First, it calibrates and validates the mechanistic model. Second, since the mechanistic model is deterministic, data carries between- and within-patient variability, so that predictions reproduce the range of genotypic and phenotypic profiles. That is the Virtual Population (VP), the cornerstone of an approach built on knowledge-driven pathophysiological models. The variability of patient phenotypic and genotypic characteristics, including time-dependent random somatic mutation, derives both from the parameters of the formal disease model and from the available omics, biological, clinical, and epidemiological datasets (Box 2). Data is not the basis on which the predictive algorithms are generated.
Feeding patient descriptor distributions from specific datasets makes the VP represent a specific real-world population and context, such as the French melanoma population [5] [6] [7].
Box 2: Reconciling knowledge & data with the Virtual Population
Legend The Virtual Population is a cohort of virtual patients whose descriptors are derived mainly from model parameters; descriptor values are sourced from a mix of knowledge and data. Knowledge captured in the literature undergoes a systematic evaluation process before being represented in a formal disease model or a descriptor. For instance, the strength of evidence of each piece of knowledge should be evaluated. An open science platform such as Jinkō helps in formalising this process. Similarly, crude data should undergo a sequence of transformations before being represented as the distribution of descriptors.
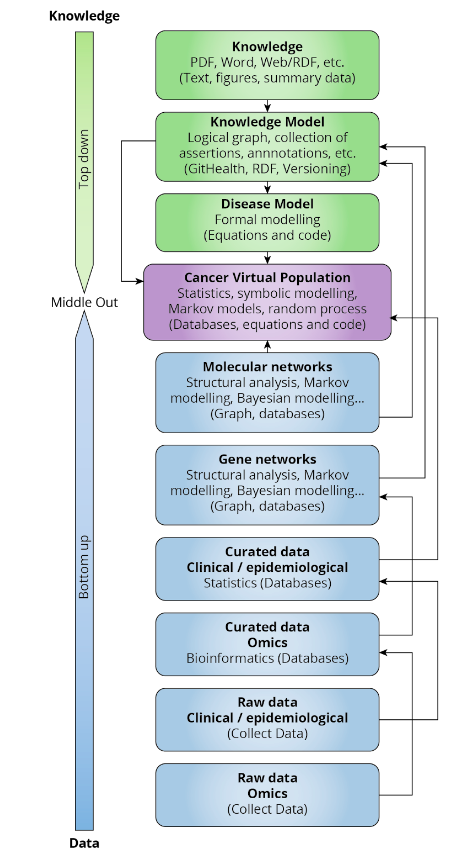
Systems biology is a step toward integrating knowledge with data. Conventional systems biology has not yet produced predictions that reach clinical outcomes, which is what in silico clinical trials need[8] [9].
Predicting clinical outcomes in silico with the Effect Model
Running in silico clinical trials needs a valid method for bridging simulation outputs and predicted clinical outcomes [8:1] [10]. That method derives from the Effect Model (EM) law (Box 3), the in silico equivalent of the randomized placebo-controlled in vivo trial in methodological standard.
The EM relates two probabilities of a disease-related event such as tumor progression, decreased quality of life, or death. Rc is the "control" risk without therapy, obtained by applying the disease model to a virtual patient. Rt is the risk with therapy, obtained by altering the disease model with the treatment or modified target model and applying it to the same virtual patient (see Box 3). Their difference, AB = Rc - Rt, is that patient's predicted individual therapeutic benefit, the Absolute Benefit. Summing the ABs over a cohort or population gives the benefit metric for that group. With the EM, the clinical efficacy of a therapeutic modality in a population becomes a quantitative, predictable metric.
This has one overarching consequence. The current R&D paradigm relies on serendipity and costly rounds of trial and error, and it faces a multiplying set of possible targets, higher investment needs, globalization, and regulatory change [11]. In silico work with the EM gives those decisions something to stand on, such as selecting the optimal target combination for a condition and patient population, driven by the EM-derived prediction of downstream efficacy on clinical outcomes. The best scenario is the one that maximizes predicted clinical benefit over the VP of interest.
Box 3: The discovery of the Effect Model law
In 1987, L'Abbe, Detsky and O'Rourke recommended including a graphical representation of the various trials when designing a meta-analysis. For each trial, on the x-axis, the frequency (risk or rate) of the studied criterion in the control group (Rc) should be represented, and on the y-axis, the frequency in the treated group (Rt) [12].
In 1993, Boissel et al., studying the effectiveness of antiarrhythmic drugs in preventing death after myocardial infarction through meta-analysis, noted that the heterogeneity between trial results persisted whichever metric they chose to measure average observed efficiency: Odds Ratio, Relative Risk, or Rate Difference. That is inconsistent with the standard statistical assumptions of meta-analysis. They showed it could be explained by focusing on the relationship between Rt and Rc, a relationship they named the "Effect Model" in a 1993 article [13] (Box 4). For these drugs the relationship is peculiar: below a certain Rc threshold, they induce more deaths than they prevent. This matches the intuition every doctor has, and what Pauker and Kassirer emphasized in 1980, that a treatment can yield little benefit and can even do more harm than good in moderately sick patients [14]. Doctors adjust their decision to a threshold they derive from what they know about the treatment at hand.
Boissel et al. based their approach on a model combining a beneficial effect proportional to Rc with a constant adverse effect independent of Rc. Mathematically, that is a linear equation with two parameters, the risk of a lethal adverse event caused by treatment and the slope of the line representing the true beneficial risk reduction:
Rt = a∗Rc+b
where (a) carries the beneficial effect and (b) the constant lethal adverse effect.
The equation gives the treatment's net mortality reduction. Fitting it to the available data by statistical regression, the authors estimated the parameter values and inferred the threshold. In theory, only patients whose untreated risk is above that threshold should be treated.
In 1998, in an editorial accompanying a study of bleeding risk with aspirin therapy, Boissel applied what would become the Effect Model (EM) law to aspirin in cardiovascular prevention. He showed that for subjects at low risk of cardiovascular events, aspirin is probably harmful [15]. At the end of the 1990s a set of studies generalized the relationship [16] [17] [18] [19]; two of them showed by simulation that the Effect Model is not linear in the general case. Those results led to the notion of an EM law. Although the law was first observed in empirical data, it later turned out to be best estimated through mathematical modeling of disease and treatment, which is also how it solves the problem of predicting treatment-related benefit on clinical outcome in in silico clinical trials.
Operating principles of the new paradigm
The Effect Model of a treatment, a clinical candidate, or a target, each alone or in combination, is estimated by combining a formal model of the disease and therapy with a Virtual Population (VP) representative of a specific geography or context (see Box 4). Through the EM law, the clinical benefit for each patient, measured by that patient's AB, is summed over the VP to give the population-level efficacy metric, the Number of Prevented Events (NPE), as shown in Box 4. The event to prevent can be death, tumor progression, a side effect, or anything else that matters. For a given treatment, disease, and duration of follow-up, the Effect Model is a relationship between the course of the disease in untreated subjects and in the same subjects treated with the intervention of interest.
Box 4: Applying the new paradigm with the Effect Model law
Legend A: Model of potential target(s) alteration; it integrates a target component of C and a target alteration profile.
B: Model of disease modifier(s); it can be a marketed drug, a compound under development, a combination of either one or more, each altering a target, or any target alteration that modifies its function(s).
C: Formal disease model, representing what is known about the disease and the affected physiological and biological systems.
E: Virtual Population, a collection of virtual patients (D) characterized by values of a series of descriptors. Each model parameter is represented by one descriptor. Other descriptors (e.g. age or compliance to treatment) may not represent a model parameter although their values are input of the model. The descriptor joint distribution is derived from data (see Box 2).
These four components and the Effect Model law (see section II.3) enable to compute the following:
When C is applied to E, simulation of the disease course on the virtual patient results in a value for Rc, the outcome probability in the control group (i.e. without treatment).
and 3. When A or B is applied to C, and A+C or B+C applied to D, this yields Rt, the probability of outcome altered by the disease modifier(s), target alteration or drug, respectively. The difference Rc – Rt is the predicted Absolute Benefit (AB), i.e. the clinical event risk reduction the (virtual) patient is likely to get from the disease modifier. AB is an implicit function of two series of variables, patient descriptors which are relevant to A and/or B, and those relevant to C. AB is the output of a perfect randomized trial since each patient is his/her own control. AB is the Effect Model of the potential target alteration (A) or of the treatment of interest.
When C is applied to each virtual patients in E, this results in all Rc for D. Alternatively, if A or B are applied to all D from E, this yields the values of Rt for all virtual patients in D. By adding all the corresponding ABs, one derives the number of prevented outcomes (or Number of Prevented Events, NPE).
The processes can be represented graphically in the Rc,Rt plane, as shown in the accompanying visual: i) for the AB of an individual virtual patient D; the dotted line represents the no-effect line, where Rt = Rc. ii) for the NPE = sum of all individual ABs.
1. Noble D. The future : putting Humpty-Dumpty together again. Biochemical Society Transactions (2003) Volume 31, part 1 ↩︎
2. Eisenstein, M. The power of petabytes. Nature 527, 3–4 (2015) ↩︎
3. Zuk, O., Hechter, E., Sunyaev, S. R. & Lander, E. S. The mystery of missing heritability: Genetic interactions create phantom heritability. Proc. Natl. Acad. Sci. U. S. A. 109, 1193–1198 (2012) ↩︎
4. Wyatt, J. Information for clinicians: use and sources of medical knowledge. Lancet 338, 1368–1373 (1991) ↩︎
5. Chabaud, S., Girard, P., Nony, P. & Boissel, J. P. Clinical trial simulation using therapeutic effect modeling: application to ivabradine efficacy in patients with angina pectoris. J Pharmacokinet Pharmacodyn 29, 339–363 (2002) ↩︎
6. Allen RJ, Rieger TR, Musante CJ. Efficient Generation and Selection of Virtual Populations in Quantitative Systems Pharmacology Models; CPT Pharmacometrics Syst. Pharmacol 5, 140–146 (2016) ↩︎
7. Rieger TR, Allen RJ, Bystricky L, Chen Y, Colopy GW, Cui Y, Gonzalez A, Liu Y, White RD, Everett RA, Banks HT, Musante CJ. Improving the generation and selection of virtual populations in quantitative systems pharmacology models. Progress in biophysics and molecular biology 139, 15-22 (2018) ↩︎
8. Boissel, J.-P., Auffray, C., Noble, D., Hood, L. & Boissel, F.-H. Bridging Systems Medicine and Patient Needs. CPT Pharmacometrics & Syst. Pharmacol. 4, 135–145 (2015) ↩︎ ↩︎
9. Hood, L. & Perlmutter, R. M. The impact of systems approaches on biological problems in drug discovery. Nat. Biotechnol. 22, 1215–1217 (2004) ↩︎
10. Boissel JP, Ribba B, Grenier E, Chapuisat G, Dronne MA. Modeling methodology in physiopathology. Prog Biophys Mol Biol. 2008;97:28-39 ↩︎
11. (2011, June 1). The productivity crisis in pharmaceutical R&D | Nature Reviews .... Retrieved May 30, 2021, from https://www.nature.com/articles/nrd3405 ↩︎
12. L’Abbe, K. A., Detsky, A. S. & O’Rourke, K. Meta-analysis in clinical research. Ann Intern Med 107, 224–233 (1987) ↩︎
13. Boissel, JP; Collet, .P; Lievre, M; Girard, P. An effect model for the assessment of drug benefit: Example of antiarrhythmic drugs in postmyocardial infarction patients. J. Cardiovasc. Pharmacol. 22, 356–363 (1993). ↩︎
14. Pauker, S. G. & Kassirer, J. P. The threshold approach to clinical decision making. N Engl J Med 302, 1109–1117 (1980) ↩︎
15. Boissel, J. Individualizing aspirin therapy for prevention of cardiovascular events. Jama 280, 1949–1950 (1998) ↩︎
16. Glasziou, P. P. & Irwig, L. M. An evidence based approach to individualising treatment. BMJ 311, 1356–1359 (1995) ↩︎
17. Boissel, J. P. et al. New insights on the relation between untreated and treated outcomes for a given therapy effect model is not necessarily linear. J. Clin. Epidemiol. 61, 301–307 (2008) ↩︎
18. Wang, H., Boissel, J.-P. & Nony, P. Revisiting the relationship between baseline risk and risk under treatment. Emerg. Themes Epidemiol. 6, 1 (2009) ↩︎
19. Boissel, J.-P., Kahoul, R., Marin, D. & Boissel, F.-H. Effect model law: an approach for the implementation of personalized medicine. J. Pers. Med. 3, 177–190 (2013) ↩︎