Part 5. Examples of Effect Model applications
TL;DR
The EM makes in silico clinical trials cheaper and faster than in vivo ones. It applies from discovery, in target selection, through to market access, in translating trial efficacy data into real-world outcomes.
The EM makes in silico clinical trials cheaper and faster than in vivo ones [1] [2]. Its primary purpose is to inform in vivo trial design, by profiling optimal responders or selecting the optimal dose-effect relationship, and so de-risk late-stage development. Its scope runs wider, from discovery and target selection through to market access and the translation of trial efficacy data into real-world outcomes.
Within that framework, comparing a PD-1 inhibitor, a CTLA-4 inhibitor, and a TIM3 inhibitor for melanoma becomes a matter of benchmarking their relative Number of Prevented Events (NPE) over the same Virtual Population (VP), for instance one representative of the US melanoma population (see Boxes 7 and 8).
Box 7: Applying the EM to combination exploration
Treatment effect is represented as an alteration of the target site on the selected pathway: inhibition of PD-1, CTLA-4 and TIM3, respectively.
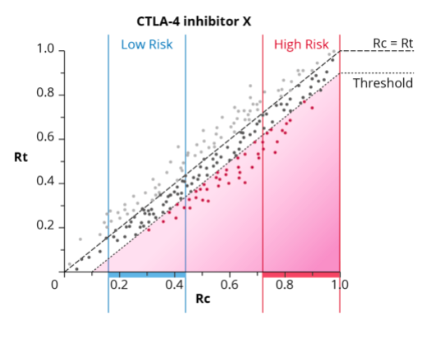
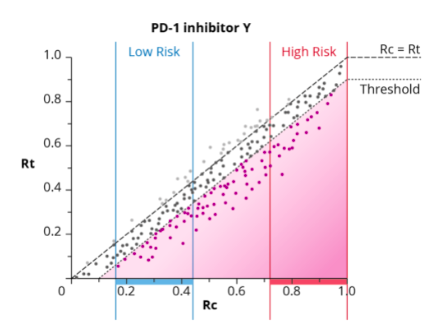
The Virtual Population combines parameters from the disease model (e.g. expression status of PD-1 gene, concentration of T-cell in the TME) with “real patient” data drawn from selected databases to represent the US population. As shown in Box 4, each dot in the Rc,Rt plane represents a (virtual) patient. Only a subset of the VP is charted on the Rc,Rt planes in the right-hand panels for clarity purposes (i.e. not all the US melanoma population is charted).
The simulation consists of:
Run I Applying the melanoma model to the VP to generate the distribution of the clinical outcome rates without treatment, Rc, over the VP.
Run II Inhibiting CTLA-4 with treatment X in the melanoma model and applying the modified disease model to each of the same virtual patients to generate the distribution of the clinical event risk modified by treatment X, Rt, and sum all resulting ABs to get the X-related NPE (plot 1 in the right-hand panel).
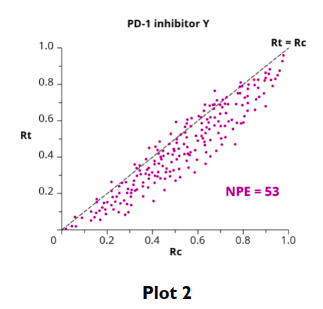
Run III Inhibiting PD-1 with treatment Y in the melanoma model and applying the modified disease model to each of the same virtual patients to generate the distribution of the clinical event risk modified by treatment Y, Rt, and sum all resulting ABs to get the Y-related NPE
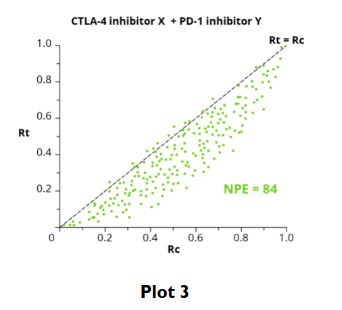
Run IV Blocking CTLA-4 with treatment X and PD-1 with treatment Y in the melanoma model and applying the modified disease model to each of the same virtual patients to generate the distribution of the clinical event risk modified by the combination of treatments X and Y, Rt, and sum all resulting ABs to get the X+Y-related NPE (plot 3 in the right-hand panel)
Compare the three NPEs (in this hypothetical case, respectively, 35, 53 and 84). The best scenario is the one corresponding to the highest NPE, i.e. 84. Thus, the combination of the PD-1 and CTLA-4 inhibitors exhibits synergistic efficacy in reducing the disease burden compared to each as monotherapy.
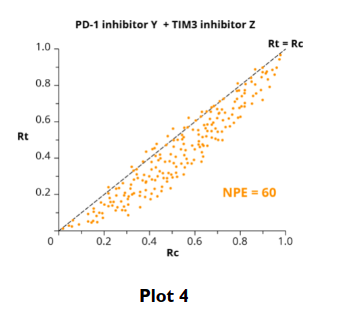
Run V The same principles apply to exploring the combination of a PD-1 inhibitor Y and TIM3 inhibitor Z (plot 4). The simulation indicates that the PD-1/CTLA-4 combination (NPE=84) yields a higher predicted clinical efficacy than the PD-1/TIM3 combination (NPE=60).
Conclusions i) Treatment Y is more efficacious than treatment X as monotherapy;
ii) The total effect of combining X and Y is less than what would have been observed if the effects of X and Y had been additive. The interaction between the two treatments is negatively synergistic;
iii) The PD-1/CTLA-4 combination compares favorably to the PD-1/TIM3 combination and should therefore be prioritized.
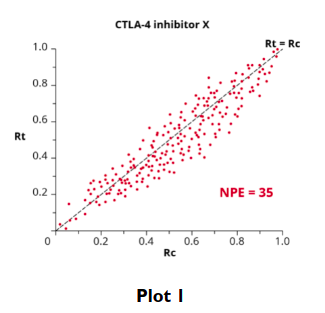
With the same disease model and VP, optimal responders are the virtual patients whose AB exceeds a pre-specified threshold. That threshold can be set in terms of relative efficacy against competing drugs, or of cost to the payer, which defines a unit cost per prevented event. Optimal responders are characterized by the set of biological and clinical parameters they share, such as cytokine expression profile, degree of immune system reactivity, or mutation profile. Theranostic biomarkers are the patient descriptors, drawn from disease model parameters, most correlated with the degree of clinical benefit (AB).
Box 8: Responder identification
Taking plots 1 and 2 from Box 6 (PD-1 and CTLA-4 inhibitors) and applying an arbitrary threshold (the dotted grey line) of 0,25 for AB to define responders (to treatments X and Y, respectively).
Were these responders all recruited in a trial comparing both compounds, the application of the EM would enable the characterization of these responders (i.e. virtual patients with an AB > 0,25) and the subsequent recruitment of the optimal profiles for a phase 3 trial. A significant difference in favor of inhibitor Y would result from such a trial designed with the support of the EM.
Conversely, a conventional trial where patients are eligible mainly on the basis of the stage of their disease (low risk or high risk areas in the plots) would likely be inconclusive in establishing these two drugs’ relative efficacy.
The EM has been applied in immuno-oncology before, once to translate clinical trial efficacy results on US patients into a prediction of real-world outcomes in another population treated with a CTLA-4 checkpoint inhibitor[4]. In cardiovascular disease, it has been applied to evaluate the efficacy of heart rate reduction in preventing stable effort angina pectoris attacks[2:1]. In chronic obstructive pulmonary disease (COPD), it is currently applied to identify both biomarkers and novel targets for preventing Chronic Lung Allograft Dysfunction (CLAD) [3].
1. Viceconti, M., Henney, A. & Morley-Fletcher, E. in silico Clinical Trials: How Computer Simulation will Transform the Biomedical Industry. (Research and Technological Development Roadmap, Avicenna Consortium, Brussels, 2016). doi:10.13140/RG.2.1.2756.6164 ↩︎
2. Chabaud, S., Girard, P., Nony, P. & Boissel, J. P. Clinical trial simulation using therapeutic effect modeling: application to ivabradine efficacy in patients with angina pectoris. J Pharmacokinet Pharmacodyn 29, 339–363 (2002) ↩︎ ↩︎
3. Pison, C. et al. Prediction of chronic lung allograft dysfunction: a systems medicine challenge. Eur. Respir. J. 43, 689–693 (2014) ↩︎
4. Boissel JP, Cogny F, Marko N, Boissel FH. From Clinical Trial Efficacy to Real-Life Effectiveness: Why Conventional Metrics do not Work. Drugs, Real World Outcomes 2019 ; 6, 125–132 ↩︎